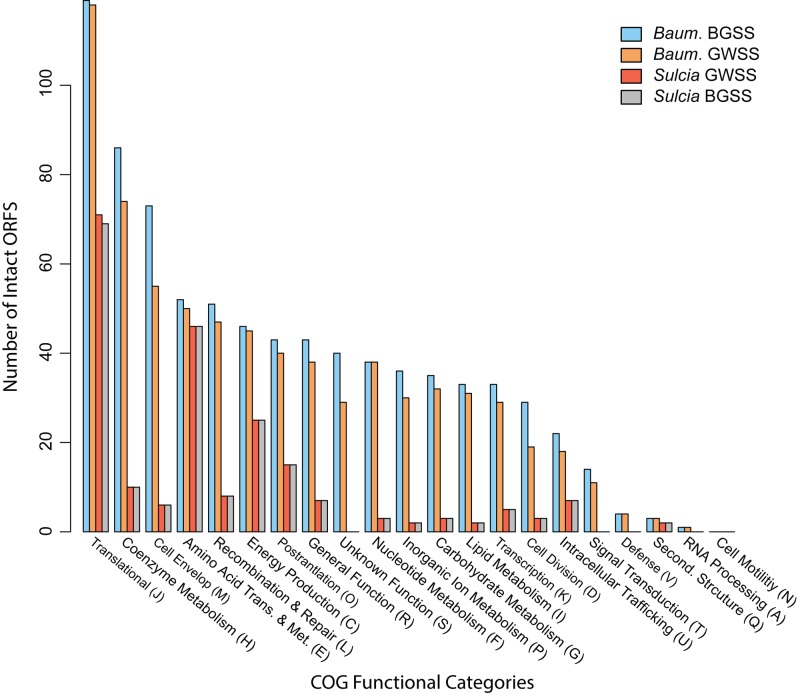
FIG 2 .
Bar chart showing distribution of functional categories of clusters of orthologous groups (COGs) for predicted protein-coding genes for “Ca. Baumannia cicadellinicola” and “Ca. Sulcia muelleri” from BGSS and GWSS. Bars are color coded according to genome (see key). ORFS, open reading frames.

