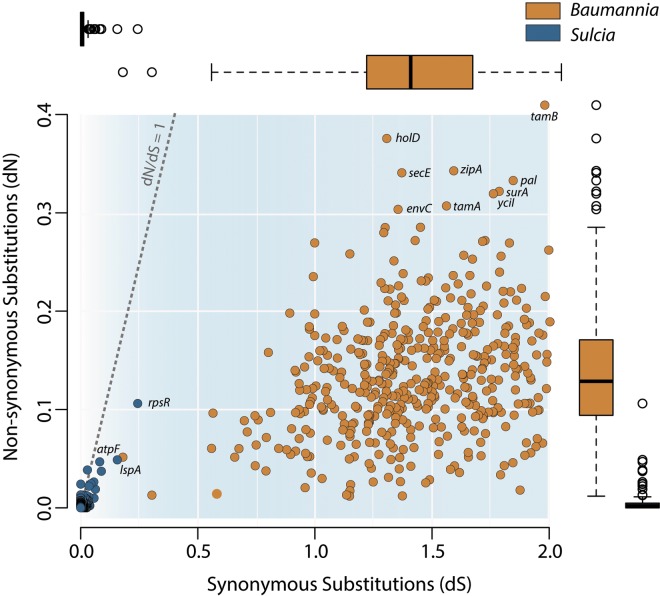
FIG 5 .
Distribution of genomewide synonymous (dS) and nonsynonymous (dN) rates of molecular evolution in “Ca. Sulcia muelleri” (blue) and “Ca. Baumannia cicadellinicola” (orange). Rates are inferred from pairwise comparisons of all shared orthologs between the symbiont strains obtained from BGSS and GWSS. Adjacent box plots show median, quartiles, and maximum and minimum distributions for dS and dN values on the x- and y-axes, respectively. Box plots are color-coded according to genome.

