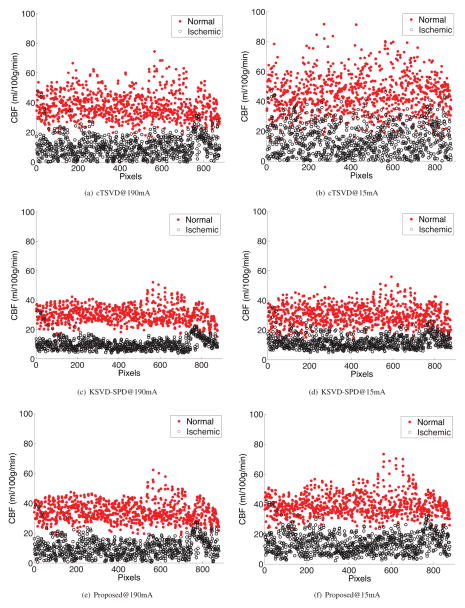
Figure 5.
Two clusters of normal vs. ischemic voxels from the aneurysmal SAH patient in Fig. 2. The results given by cTSVD, KSVD-SPD and our proposed ODL-SPD are shown in the 1st, 2nd and 3rd row, respectively, each with CBF map of high-dose (190mA) CTP data on the left and that of low-dose (15mA) on the right.

