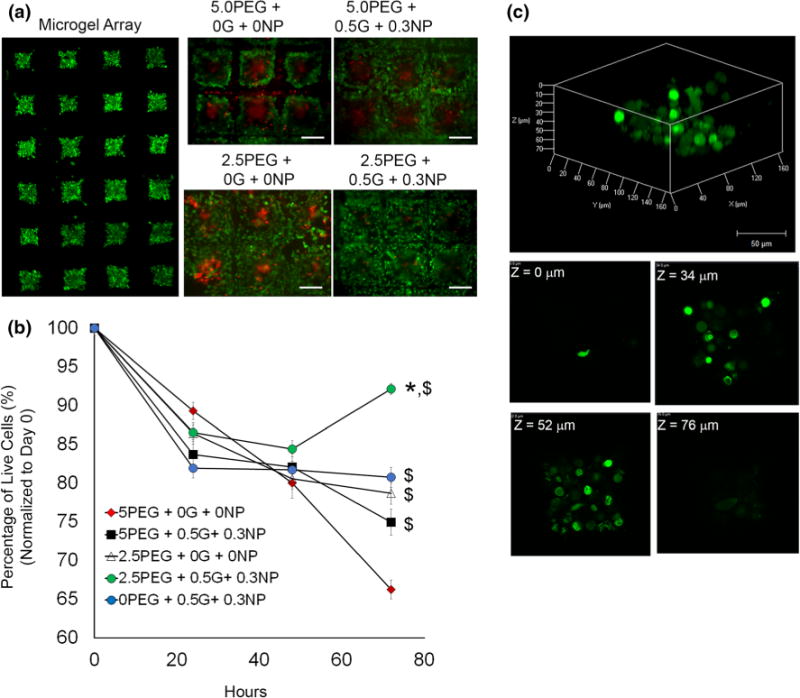
FIGURE 5.

Live/Dead cytotoxicity studies. (a) Fluorescent micrograph of a representative microgel array at t = 0. Individual panels for each microgel group represents live (green) and dead (red) cells on day 3. Scale Bar = 200 μm. (b) Scatter plot of cell viability profiles for each microgel formulation over a period of 72 h. All samples were seeded with 4 × 10⁵ cells at t = 0. Data represents % survival normalized to t = 0. *p<0.05 compared to all other groups at 72 h; $p<0.05 compared to 5% PEG-MAL only gels (red) at 72 h. n = 16. (c) 3D reconstruction of a whole 2.5P+0.5G+0.3NP microgel with individual z-sections at indicated depth.
