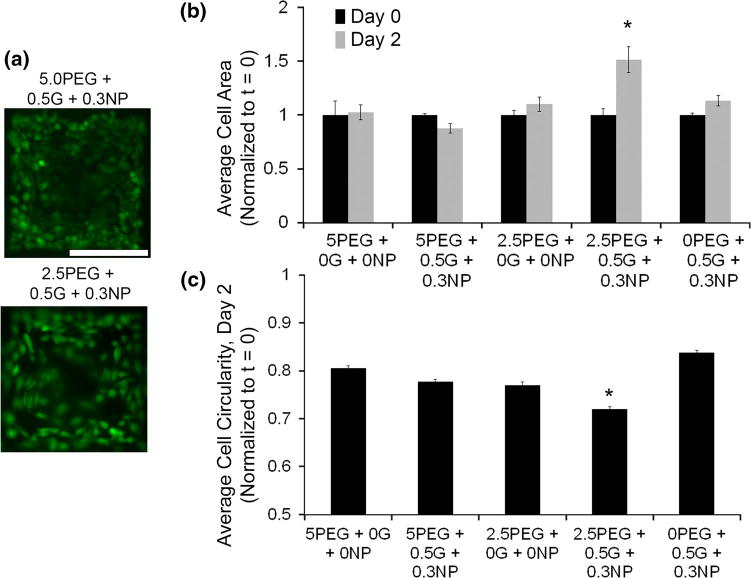
FIGURE 7.

Anchorage-dependent cell spreading. (a) Fluorescence micrographs represent spreading behavior of encapsulated HeLa cells in representative microgel formulations. (b) Bar graph represents average cell spreading for each microgel group, normalized to day 0 spreading areas. *p < 0.05 compared to all microgel groups on day 2. n = 5. (c) Bar graph represents average cell circularity indicative of change in cells shape and spreading. *p < 0.05 between compared all other microgel groups. n = 6.
