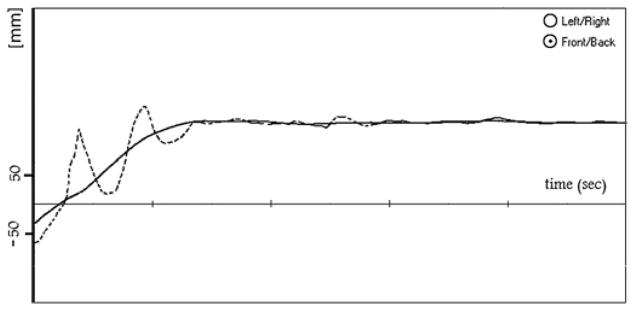
Figure 1.

Example of the analysis of the posturography curve (Patient 1, same curve as in figure 2B): the trace has been windowed starting with the deflection marking the beginning of sitting up. Dashed curve: original, continuous line: filtered curve. Fosc: 69%. Units: time axis =1 s, ordinate =movement of the centre of pressure (mm).
