
Figure 5.
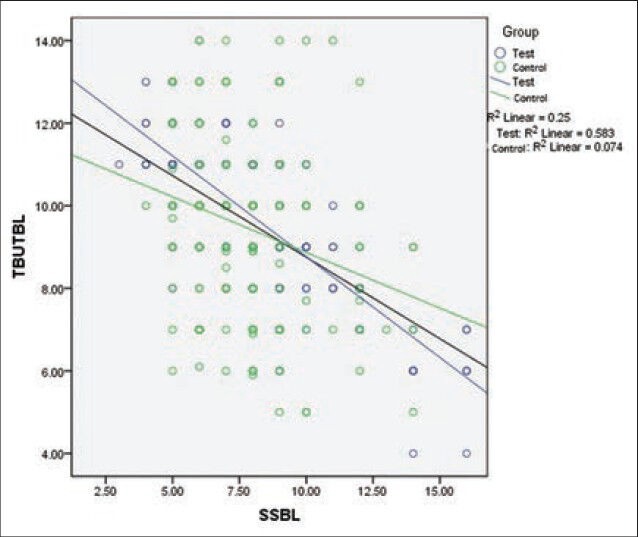
Scatter diagram showing correlation analysis between dry eye symptoms score and tear film break up time
Official websites use .gov
A
.gov website belongs to an official
government organization in the United States.
Secure .gov websites use HTTPS
A lock (
) or https:// means you've safely
connected to the .gov website. Share sensitive
information only on official, secure websites.
Scatter diagram showing correlation analysis between dry eye symptoms score and tear film break up time