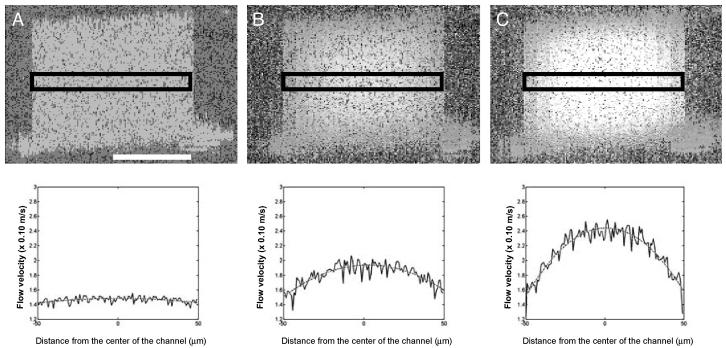
Fig. 3.
Doppler OCT images (Upper) and plots (Lower) showing the 3D and 2D flow profiles, respectively, across the straight channel in a Y channel mixer at flow rates of 0 m/sec (A), 3.3 × 10⁻² m/sec (B), and 6.6 × 10⁻² m/sec (C). The 3D images represent two spatial dimensions with pixel intensity proportional to fluid-flow velocity. The rectangle in each image indicates the area from which flow-velocity information was extracted. The phase was averaged over adjacent samples to increase the signal-to-noise ratio of the resulting velocity profile. The solid lines in the plots indicate the experimental flow-velocity profile, and the dotted lines indicate the theoretical flow-velocity profiles. The baseline for static flow is at 1.4 × 10⁻¹ m/sec. [Scale bar, 50 μm (applies to all images).]

