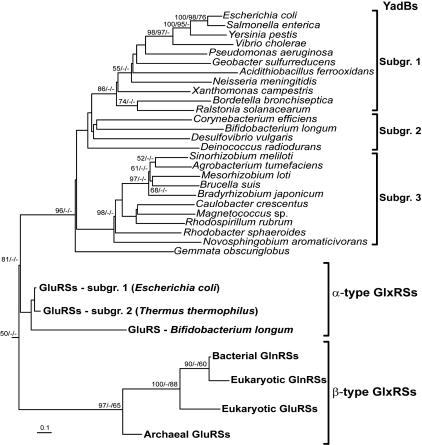
Fig. 5.
Rooted phylogenetic tree of YadB proteins and GluRS/GlnRS representatives. Bootstrap values (>50%) calculated from 400 replicates in the maximum-parsimony analysis, 1,000 replicates in the neighbor-joining analysis, and 5,000 puzzling steps in the maximum-likelihood analysis are indicated at their corresponding nodes separated by ′/′ in that specific order. The tree is rooted with P. horikoshi class I LysRS (not shown).

