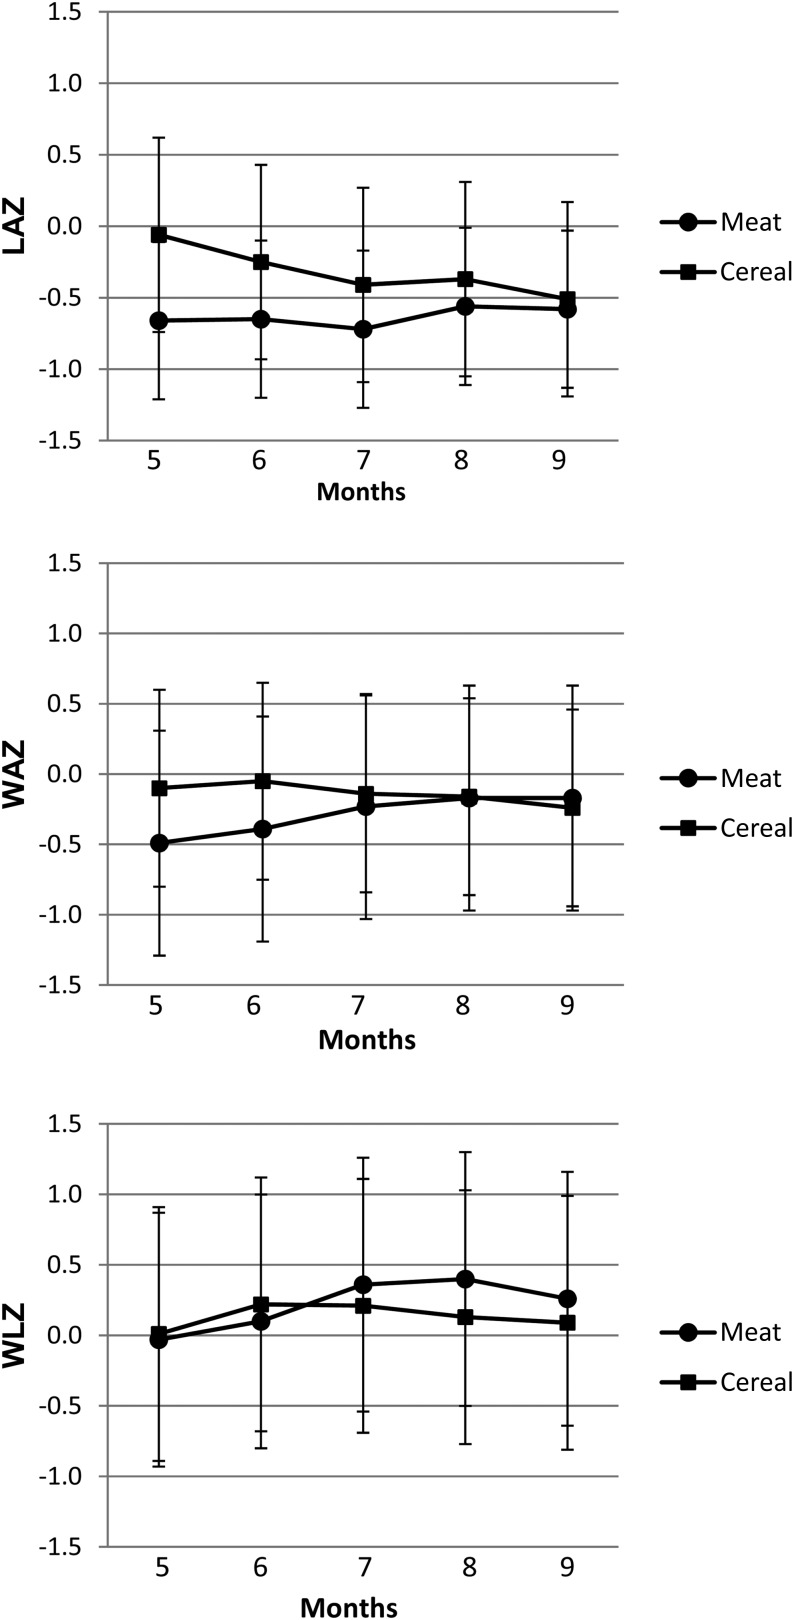
FIGURE 1.
Mean (±SD) longitudinal z scores of anthropometric measures by group. Meat group: n = 14; Cereal group: n = 28. A repeated-measures ANOVA used group (Meat group compared with Cereal group) and time (pre compared with post) as the 2 variables and showed a group-by-time interaction for both the LAZ and WAZ (P < 0.05) as follows: the LAZ decreased in the Cereal group, and the WAZ increased in the Meat group and decreased in the Cereal group. Cereal group, lower-protein group; LAZ, length-for-age z score; Meat group, higher-protein group; WAZ, weight-for-age z score; WLZ, weight-for-length z score.

