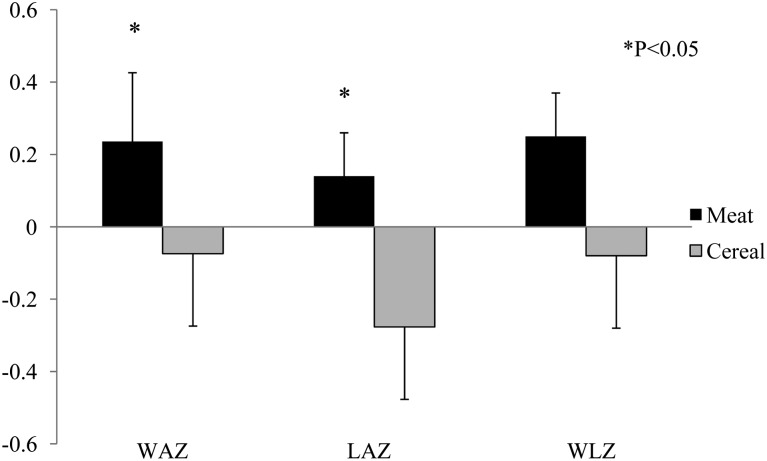
FIGURE 2.
Mean (±SD) changes in WAZ, LAZ, and WLZ over time (5–9 mo of age) between groups. Meat group: n = 14; Cereal group: n = 28. A 1-factor ANOVA of group and baseline (5 mo of age) LAZs or WAZs as covariates showed that changes in the WAZ and LAZ were both different between groups (P < 0.05). Mean values presented for WAZs and LAZs were adjusted means. Cereal group, lower-protein group. LAZ, length-for-age z score; Meat group, higher-protein group; WAZ, weight-for-age z score; WLZ, weight-for-length z score.

