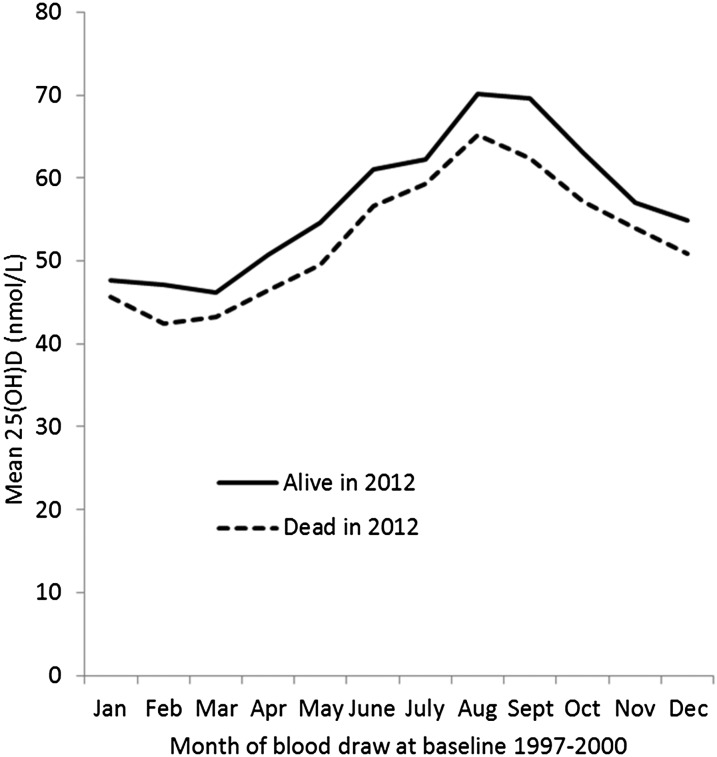
FIGURE 1.
Mean serum 25(OH)D concentrations by month at the 1997–2000 baseline examination in subjects alive and subjects dead at follow-up in 2012. The mean difference in baseline 25(OH)D concentrations in subjects alive compared with subjects dead in 2012, adjusted by age, sex, and month was +3.8 nmol/L (P < 0.0001). Estimated coefficients in nanomoles per liter to add to 25(OH)D concentration in nanomoles per liter to adjust for the month of blood draw to characterize the individual annual mean were as follows: Jan, +9; Feb, +11; Mar, +11; Apr, +6; May, +3; June, −4; July, −5; Aug, −12, −Sep, −11; Oct, −5; Nov, (mean); Dec, +2. 25(OH)D, 25-hydroxyvitamin D.

