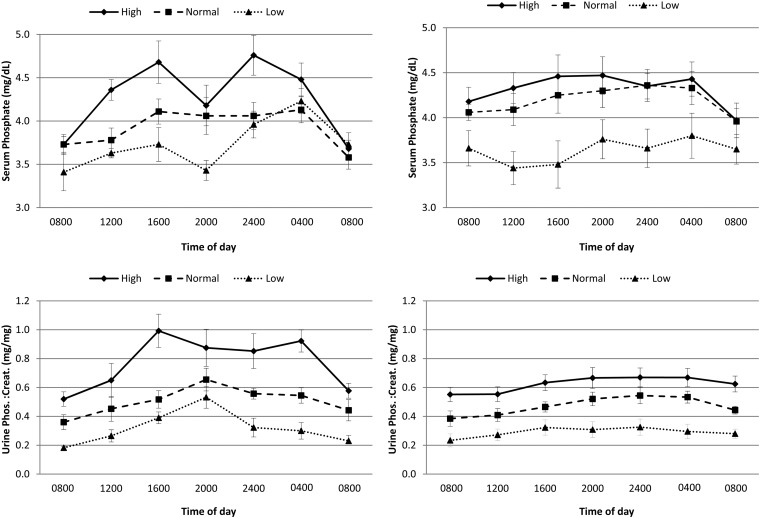
FIGURE 1.
Serum phosphate concentration and urine phosphate:creatinine ratio in healthy controls (n = 4) and CKD patients (n = 11) throughout the day and across high-, normal-, and low-phosphate diets. Point estimates reflect mean concentrations, and error bars reflect SEs. The top panels show serum phosphate concentrations in healthy control and CKD participants. P values for diet × time interactions were 0.02 in the healthy control group and 0.02 in CKD participants. The bottom panels show urine phosphate:creatinine ratios in healthy control and CKD participants. P values for the diet × time interactions were 0.11 and 0.48 in healthy control and CKD participants, respectively. CKD, chronic kidney disease; Creat., creatine; Phos., phosphate.

