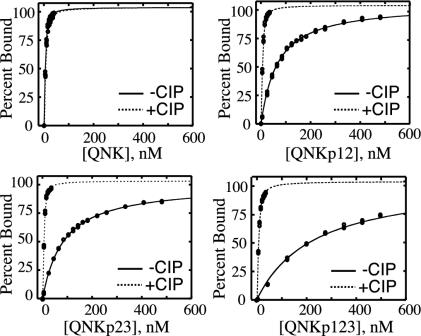
Fig. 4.
DNA binding by QNK-QNK-RHR in its four phosphorylation states. The figure shows the percentage of the oligonucleotide probe bound (deduced from changes in fluorescence anisotropy) as a function of protein concentration, comparing the results before (-CIP) and subsequent to (+CIP) treatment with calf intestinal phosphatase.

