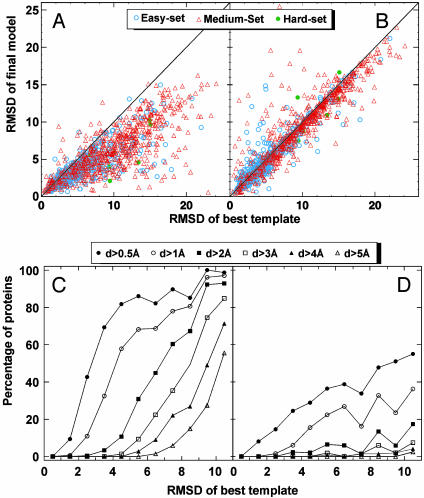
Fig. 3.
(A) Scatter plot of rmsd to native for final models by tasser versus rmsd to native for the initial templates from prospector_3 (6). The same aligned region is used in both rmsd calculations. (B) Similar data as in A, but the models are from modeller. (C) Fraction of targets with a rmsd improvement d by tasser approach greater than some threshold value. Here, d = “rmsd of template” - “rmsd of final model.” Each point in C is calculated with a bin width of 1 Å; however, the last point includes all templates with rmsd > 10 Å. (D) Similar data as in C, but the models are from modeller.

