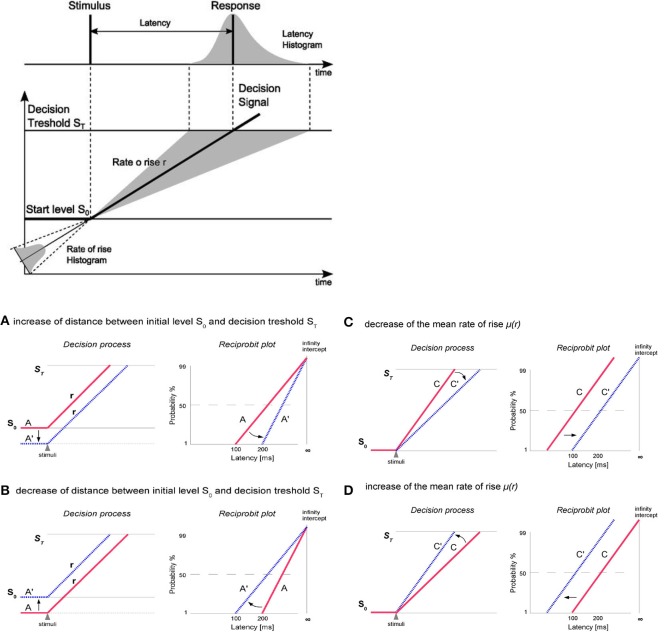
Figure 2.
At the top: The LATER model. At the moment of target presentation, the decision signal starts form initial level SO and rises linearly with a rate r until reaching the decision threshold ST what causes the generation of saccade. The rate of rise varies randomly from trial to trial (about a mean μ), resulting in a skewed distribution toward the responses with longer latencies. At the bottom: Changes in the parameters of the LATER model have distinct effects on the reciprobit plot. (A,B) Alternations in the distance between ST and SO (here evoked by So change, but ST may also by modified) causes swiveling of the distribution line about the point (I) where it intersects the vertical infinite-time axis. Parameter ST can be modified due to a different instruction given to the subjects (e.g., “react as fast as possible” or “react as accurate as possible”). Variation in S0 can be caused by a different probability of the target dislocation. (C,D) Changes in the rate of information supply affect the mean (μ) rate of rise of the decision signal and causes parallel shift of the distribution line along the time axis (leftward-reduction of latency or rightward-increase of latency) without a change in the slope.

