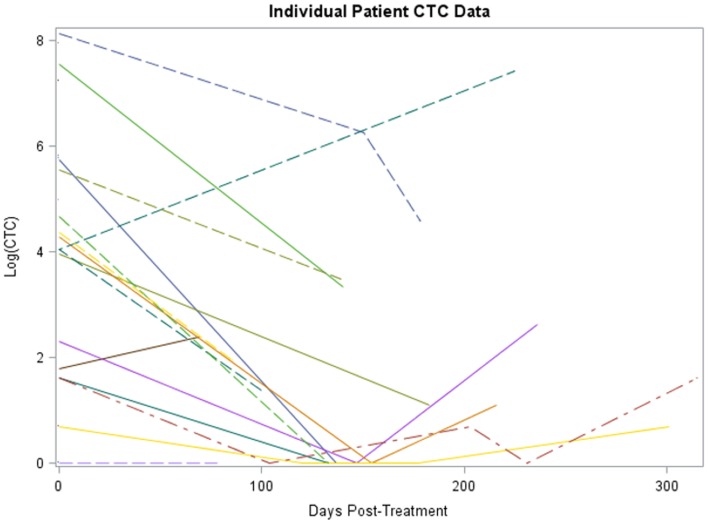
Figure 1.
Plot of individual patient-level CTC change data (log scale). The x-axis is number of days post-treatment at which the CTC measurement was collected for patient, y-axis is the percent change from baseline at that time for each patient, each patient has a line representing his or her change.

