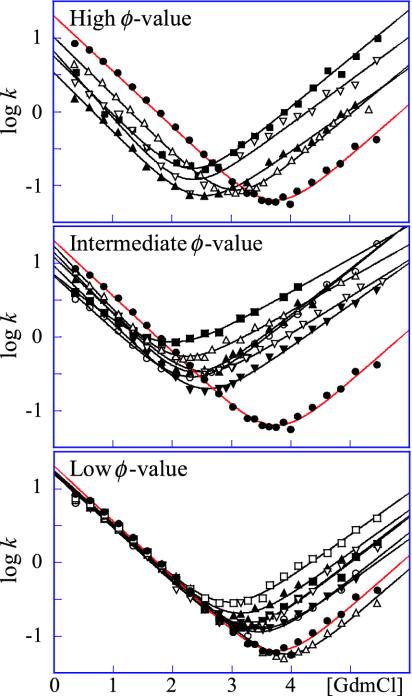
Fig. 2.
Chevron plots for wild-type (•) and mutant L23, grouped according to their φ values. Units for the rate constants are in s-1. (Top) Mutants with φ > 0.25. V30A (▪), V81A (▴), V43A (▿), and I39V (▵). (Middle) Mutants with 0.25 > φ > 0.10. Y26A (▪), V49A (▴), V51A (▿), V54A (▵), I80A (▾), and V83A (○). (Bottom) Mutants with φ < 0.10. I8V (▪), V12A (▴), L13A (▿), Y18A (▵), F21A (▾), L57A (○), and I89A (□). In Figs. 3 and 4, mutants with high, intermediate, and low φ values are red, orange, and yellow, respectively. In Table 1, mutants with high and intermediate φ values are bold and underlined, respectively.

