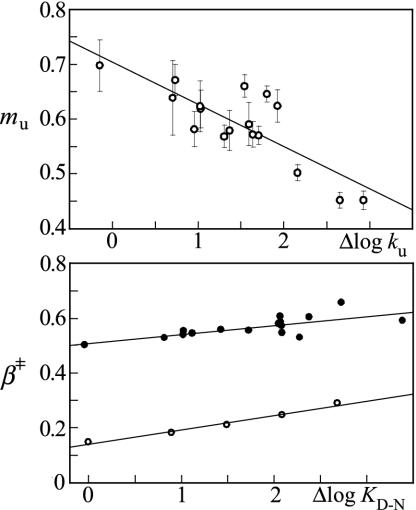
Fig. 5.
m values change after mutational perturbation of L23. (Upper). Hammond plot (mu versus Δlogku) showing that the scatter of the mu values is larger than the experimental errors. The fitted line is mu = 0.7–0.077(±0.01)Δlogku, R = 0.82. (Lower) Comparison of the Hammond plots β‡ versus ΔlogKD-N from data in Table 1 (•) and the Brønsted slopes (<φ> in Fig. 3) versus ΔlogKD-N = <mD-N>[GdmCl] (○). β‡ = 0.5 + 0.033(± 0.01)ΔlogKD-N (R = 0.74) and <φ>= 0.14 + 0.053(± 0.004)ΔlogKD-N (R = 0.99). Although the absolute values for the transition-state position are different, their dependence on ΔlogKD-N is overall similar, providing additional evidence for transition state movements in L23.

