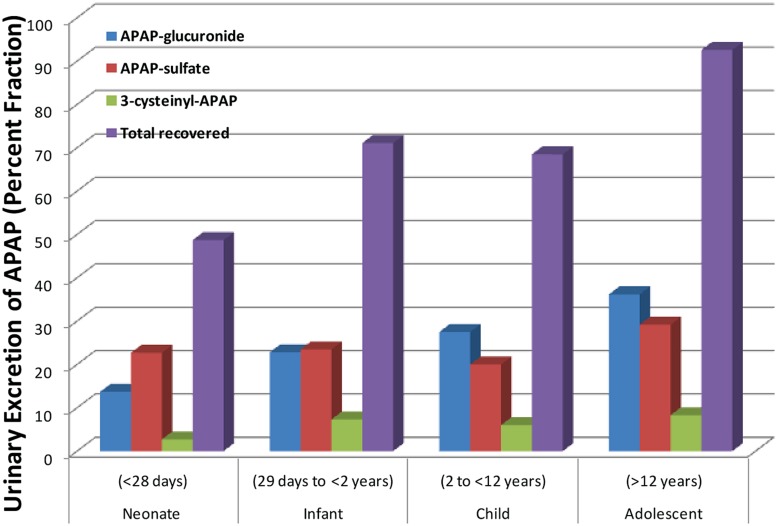
FIGURE 2.
Differing amounts of the metabolites of acetaminophen that are excreted into the urine across different age groups. [Data were adapted from Zuppa et al. (2011) with permission]. Shown here is the steady state urinary data presented as percent fractional excretion (y-axis).

