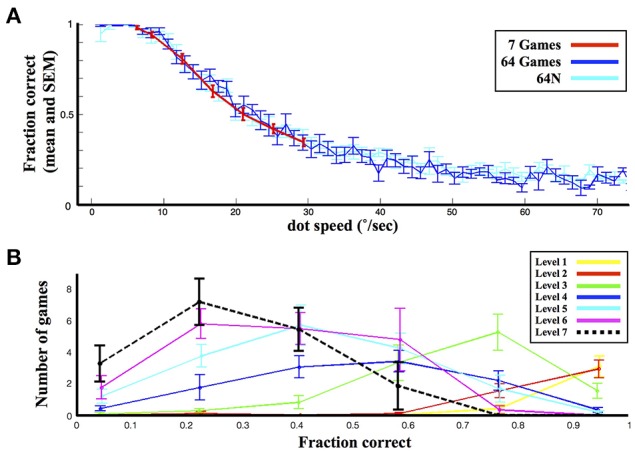
Figure 2.

General performance. (A) Performance as a function of speed in the 3 versions. Each bin represents the average and standard error (s.e.m.) of the fraction correct for the corresponding dot speed across all the subjects tested. (B) The distribution of performance levels in the 7-game condition. The points show the average and s.e.m. (across subjects) of the number of games in each of 6 performance bins.
