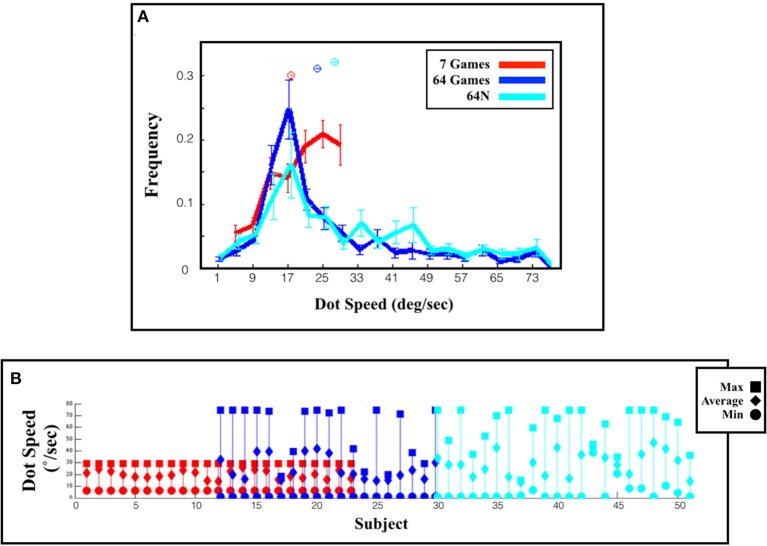
Figure 4.
Range of selected games. (A) Distribution of the selected speeds (top) and fraction correct (bottom) across an entire session. The values show the mean and s.e.m. across subjects. (B) Choices of individual subjects. Each line represents one subject and shows the maximum, minimum and average dot speed selected by that subject. Subjects are ordered according to the task version (or task combination) that they performed, and in chronological order within a task group.

