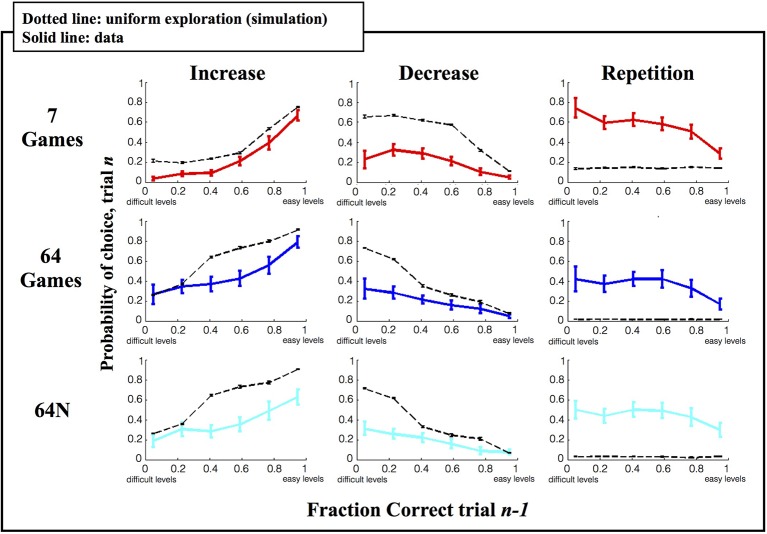
Figure 5.
Local strategy for game selection. Each point shows the average and s.e.m. of the probability to repeat, increase or decrease difficulty as a function of prior game performance. Solid colored traces show the empirical data, dotted black traces show the results of simulations using a random game selection strategy.

