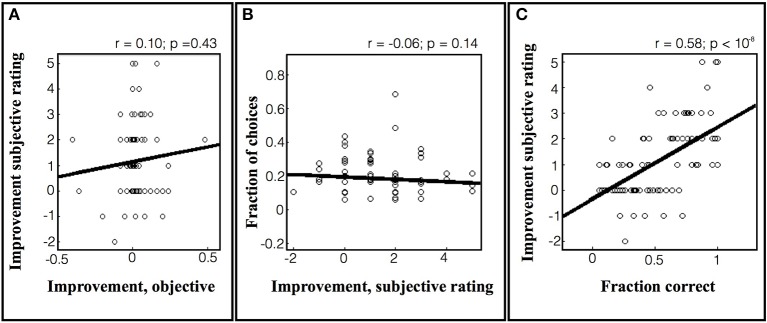
Figure 7.

Subjective rating of learning progress in the 64-game task. (A) Subjective improvement rating as a function of actual improvement. Each point represents a game that was rated by a subject after the end of the session, and the data are pooled across subjects. The y axis shows the subject's rating of his/her own improvement and the x axis shows the objective improvement in units of %correct/game. The lines show best fit linear regression across subjects. (B) The probability of selecting a game as a function of the subjective improvement rating. (C) Subjective rating as a function of average performance.
