Fig. 2.
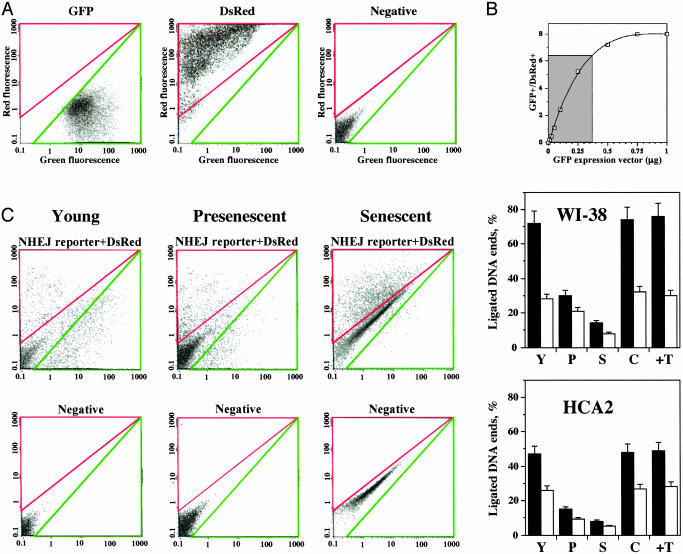
Efficiency of NHEJ declines during cellular senescence. (A) Calibration of the parameters for FACS analysis. Cells were analyzed on a red-versus-green fluorescence plot. The gating for the analysis of green and red cells was set up by using cells transfected with 5 μg of GFP or 5 μg of DsRed vectors, and the cells were transfected with a negative control plasmid expressing the hypoxanthine phosphoribosyltransferase gene (to exclude autofluorescent cells). GFP and DsRed- cells possess autofluorescence and fall along the green/red diagonal, whereas GFP+ and DsRed+ cells appear in separate populations shifted off the diagonal. (B) Relationship between the amount of transfected DNA and the number of GFP+ cells. Cells were transfected with various amounts of circular GFP-Pem1 vector (from 0.01 to 1 μg) mixed with 0.1 μg of pDsRed. After 72 h, the percentages of red and green cells were determined by FACS analysis. The ratio of GFP+ to DsRed+ cells was plotted as a function of the amount of GFP-Pem1 vector. The shaded area indicates the range of GFP+/DsRed+ obtained upon transfection with digested NHEJ substrate. (C)Efficiency of NHEJ in young, presenescent, and senescent WI-38 and HCA2 fibroblasts. Cells were cotransfected with 0.5 μgof HindIII- or I-SceI-digested NHEJ reporter substrate and 0.1 μg of the DsRed expression vector. The numbers of green (GFP+) and red (DsRed+) cells were determined by FACS analysis, and typical FACS traces are shown. The ratio of GFP+ to DsRed+ was used as a measure of NHEJ efficiency. The percent of ligated DNA ends was determined by using the curve shown in B. Hind III, filled bars; I-SceI, open bars. All experiments were repeated at least five times and the SD are shown. Y, young cells; P, presenescent; S, senescent; C, confluent; T, nTERT-immortalized.

