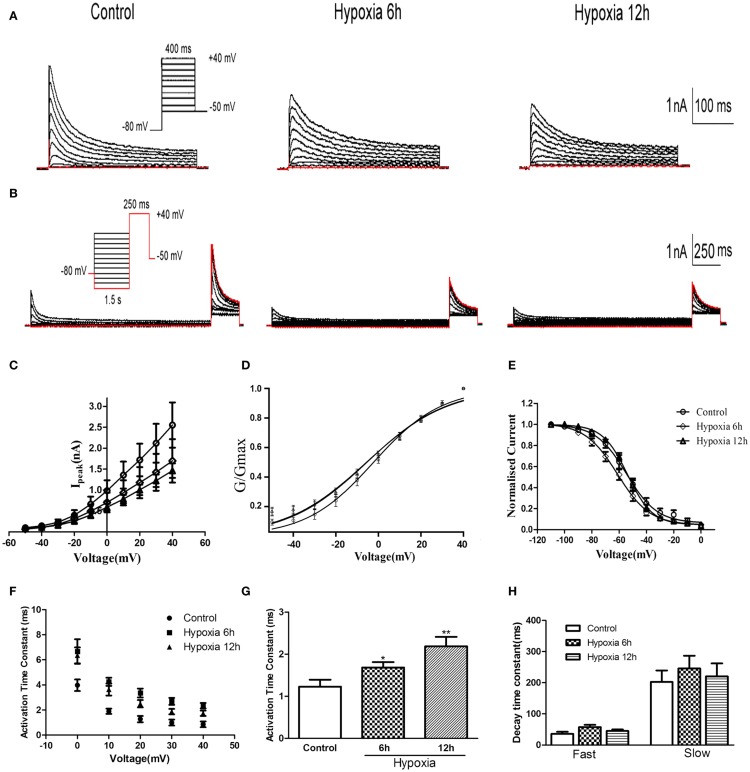
Figure 2.
Voltage-dependence of activation and inactivation of transient currents at 6, 12 h after hypoxia in the HEK293 cells. (A) Superimposed current traces evoked by depolarizing steps to potentials between −50 and +40 mV with 10 mV increment after −80 mV. (B) Superimposed current traces evoked by test depolarization to +40 mV after 1.5 s pre-pulse to potentials between −110 and 0 mV with 10 mV increment. (C) Averaged I–V relationship obtained in the HEK293 cells. The peak currents were reduced by hypoxia treatment. Each curve represents the Mean ± SEM of 10–15 cells. (D) Mean normalized conductance–voltage relations for the peak outward Kv4.2 currents recorded in HEK293. (E) Voltage-dependences of steady-state inactivation of Kv4.2-induced K+ currents in HEK293. (F) Activation time constants of Kv4.2 currents were determined from single exponential fits to the rising phases of the currents. The activation time constants are voltage-dependent. (G) The activation time constants (τ) (evoked at +40 mV) were increased after hypoxia treatment. Mean ± SEM was displayed. (H) Decay time constants of Kv4.2 (evoked at +40 mV) in HEK293 cells were fitted by bi-exponential function. Both of the fast and slow-decay time constant of kv4.2 currents were not significantly change after hypoxia treatment. Mean ± SEM was displayed. *p < 0.05, **p < 0.01.

