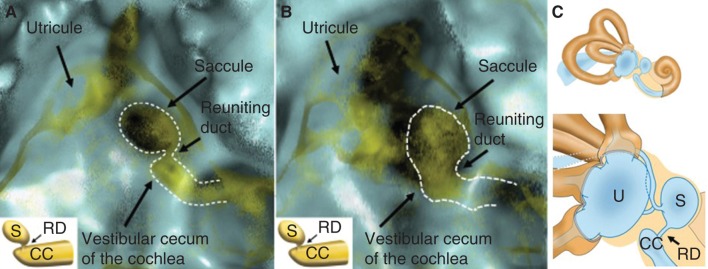
Figure 4.

MICS (membranous image between the vestibular cecum of the cochlea and saccule) in a right healthy (A) and Meniere’s disease (MD) (B) ear, and schematic representation of the vestibule (C). The neck-like narrow line, here represented with a dotted line, indicates the localization of the reuniting duct. Note that the MD ear has a wide, irregular, and condensed reuniting duct, whereas that of the healthy ear is narrow. CC, vestibular cecum of the cochlea; RD, reuniting duct; S, saccule; U, utricle.
