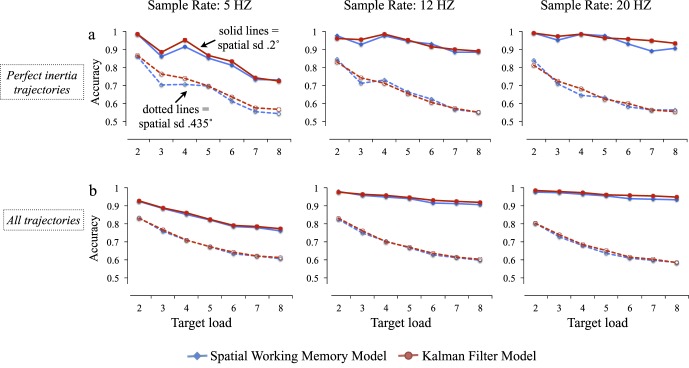
Figure 4.
Results of Experiment 1. Models tested differed in terms of their sampling rates (separated by panels left to right) and spatial standard deviation (dotted lines = 0.435° models, solid lines = 0.2° models). There were no large differences in performance between the Kalman filter model (red) and the spatial working memory model (blue). This was true both for trajectories with perfect inertia (a), and averaged across the wide range of trajectories tested (b). (For simplicity models with 0.6° precision are not shown, though results were similar).

