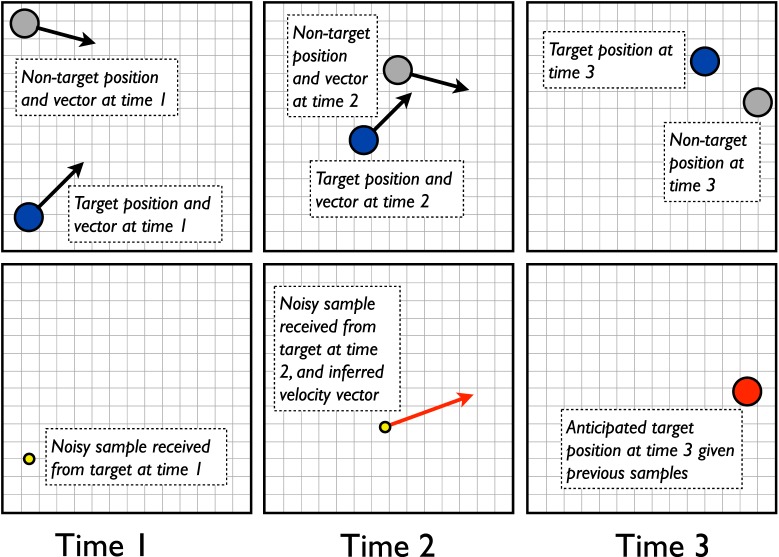
Figure 14.
Schematic diagram of target and nontarget motion over three moments, contrasted with potential noisy samples and predictions of an observer. The diagram is meant to illustrate how noisy predictions can deviate from true outcomes, and how they could lead to correspondence errors in the MOT task. Objects in the top row indicate the actual positions of a target (blue) and a nontarget (gray) at three successive moments, in addition to their actual and stable motion vectors. Small yellow circles (bottom row) designate noisy samples received by an observer from the target at Moments 1 and 2. The red arrow at Time 2 designates the most-likely motion vector an observer would infer on the basis of those samples, and the larger red circle at Time 3 designates the best prediction the observer would make, as a result, about the object's expected position at Time 3.

