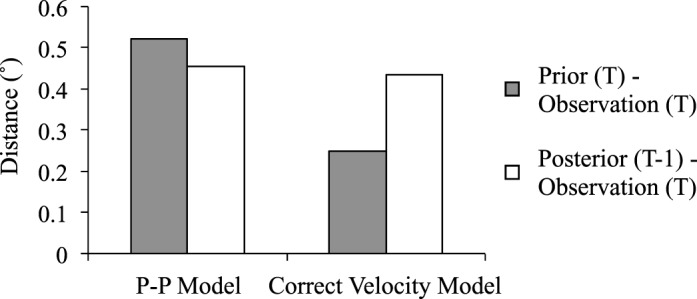
Figure 16.

Average distance between prior at time T and observation at time T (gray bars) and between posterior at time T-1 and observation at time T (white bars), for the P-P Kalman filter model and the correct velocity model, respectively. Results are from models with a 0.2° spatial resolution and 12 Hz sampling rate. Patterns were the same for models with other parameters. The correct velocity model made predictions that were closer to new observations than the most recent posterior. But for the P-P model, the opposite was true.
