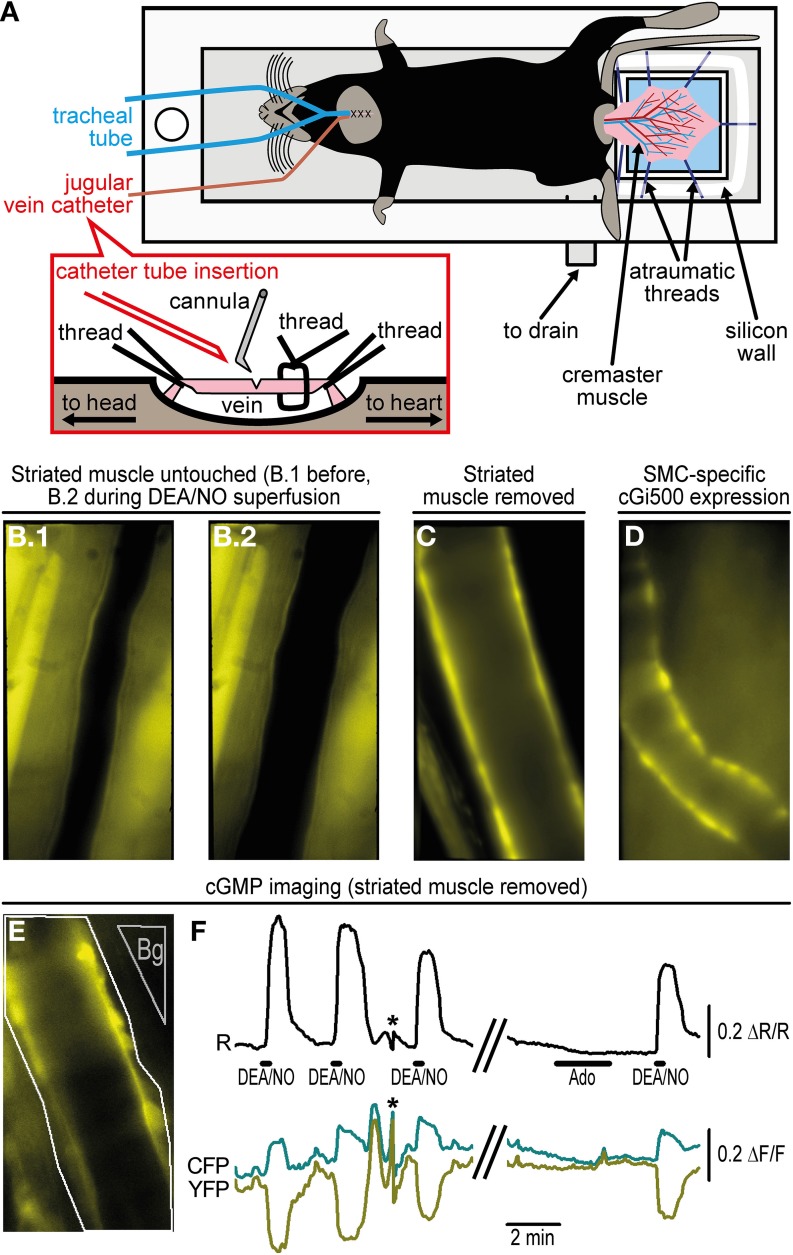
Figure 2.
Imaging of cGMP within the cremaster microcirculation. (A) A custom-made acrylic glass stage holds the anesthetized mouse in supine position on a heating pad (not shown). The cremaster muscle has been surgically exteriorized and fixed with atraumatic threads on top of a coverslip (light blue). Threads are pinned through a silicone wall that surrounds the coverslip as a semicircle. The cremaster is superfused with pre-warmed (34°C) salt solution delivered along the objective lens (not shown) approaching the cremaster from top. The solution is drained through the outlet at the bottom of the stage. For mechanical ventilation, a tube has been inserted into the trachea. A detailed depiction of jugular vein cannulation is shown in the inset. (B) Arteriole within the intact cremaster muscle of a R26-CAG-cGi500(L1) mouse. B.1 shows the vessel before and B.2 during superfusion of 10 μM DEA/NO that causes vasodilation. Estimation of cGMP levels was not possible under this condition, because strong fluorescence from striated muscle prevented FRET measurements within the vessel wall. (C) After removal of striated muscle, walls of cremaster arterioles of a R26-CAG-cGi500(L1) mouse are clearly visible, but they lost their basal tone and did not dilate upon superfusion with DEA/NO or other vasoactive drugs. (D) In an intact cremaster preparation of a R26-CAG-cGi500(L2); SMA-CreERT2 double-transgenic mouse, only the vessel walls show cGi500 expression. The animal was treated for 5 days with 1 mg tamoxifen (i.p.) per day to induce CreERT2-mediated activation of the R26-CAG-cGi500(L2) transgene specifically within SMCs. The image was taken 1 week after the last tamoxifen injection. (E) Definition of ROIs (arteriole: white outline; background region: gray, “Bg”) for cGMP imaging in the cremaster of a R26-CAG-cGi500(L1) mouse after removal of striated muscle. (F) Cyclic GMP imaging of the arteriole shown in (E); the black trace indicates baseline-normalized CFP/YFP ratio changes (ΔR/R) representing intracellular cGMP levels; cyan and yellow traces represent baseline-normalized CFP and YFP fluorescence intensity changes (ΔF/F). Repeated application of 10 μM DEA/NO induced reversible cGMP transients, while 10 μM adenosine (Ado), known to induce relaxation via the cAMP pathway, did not induce detectable ratio changes. Antiparallel changes of CFP and YFP intensities are indicative for true changes of cGi500 FRET efficiency. Asterisks denote artifacts due to focus drift. Acquisition parameters were as follows: excitation: Polychrome V at 420 nm; objective: 40×; acquisition frequency: one image every 0.5 s; camera: Andor iXon 885 with 2 × 2 binning (251 × 501 pixels) and gain set to 25; exposure time: 150 ms. Temporal binning of six frames was done before evaluation performed by subtraction of a background region. Evaluation via image segmentation led to similar results but lower ΔR/R values (not shown). All images (B–E) were obtained at 40× original magnification. Panels E and F are reproduced from Thunemann et al. (2013b) and show representative results from experiments with three animals.

