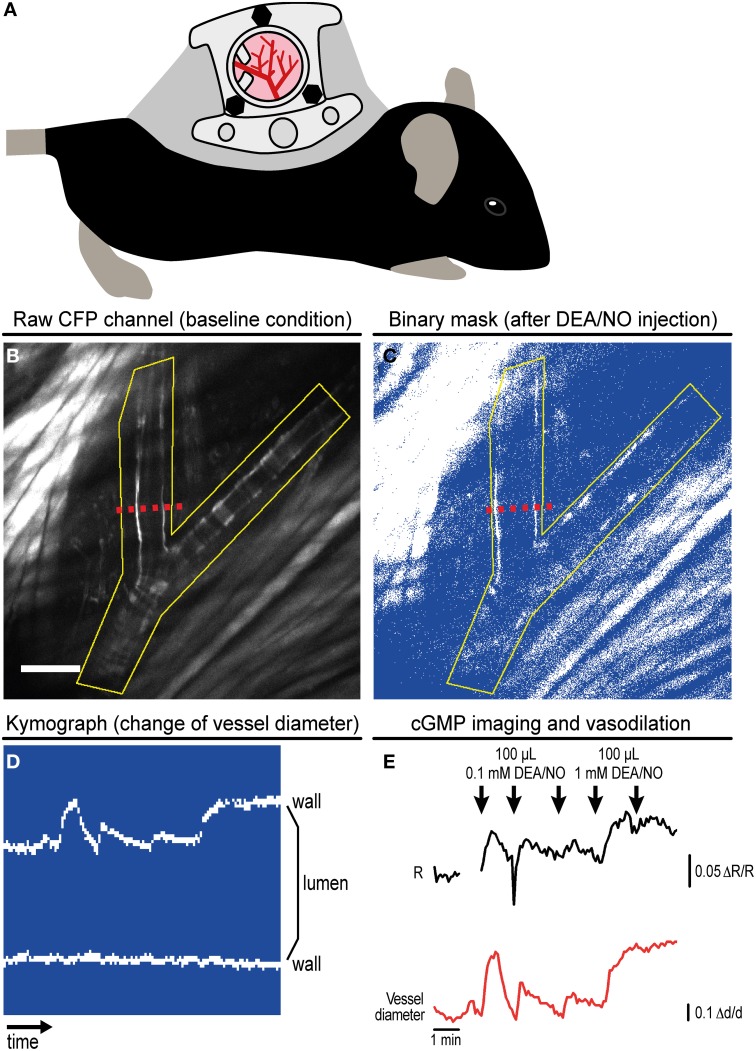
Figure 3.
Imaging of cGMP in subcutaneous vessels using the dorsal skinfold chamber (DSC). (A) Schematic drawing of a mouse with implanted DSC. (B) Field of view observed with MP microscopy through the DSC used for cGMP imaging as shown in (C–E). (B) shows the tissue before DEA/NO injection. Scale bar: 100 μm. (C) Image from the dynamic binary mask showing the tissue shortly after DEA/NO injection. (D) Kymograph showing movements of the vessel wall at the cross-section indicated by dashed red lines in (B,C) (time increases from left to right). Vasodilation was solely caused by movement of the upper vessel wall (left wall in B,C). (E) Cyclic GMP imaging of the (yellow) ROI outlined in (B,C). The black trace shows changes of the baseline-normalized CFP/YFP ratio (ΔR/R) upon three intravenous injections of 0.1 mM DEA/NO followed by two injections of 1 mM DEA/NO. Few time points were omitted due to disturbance of image acquisition by ambient light. The relative vessel diameter change (Δd/d, red trace) was determined from the kymograph shown in (D). Acquisition parameters were as follows: excitation: 850 nm with 36 mW at the tissue surface; objective: 20×; acquisition frequency: one image every 5 s; image size: 512 × 512 pixels (707.11 × 707.11 μm). (B,E) are reproduced from Thunemann et al. (2013b). Representative results from five experimental sessions with three animals are shown.

