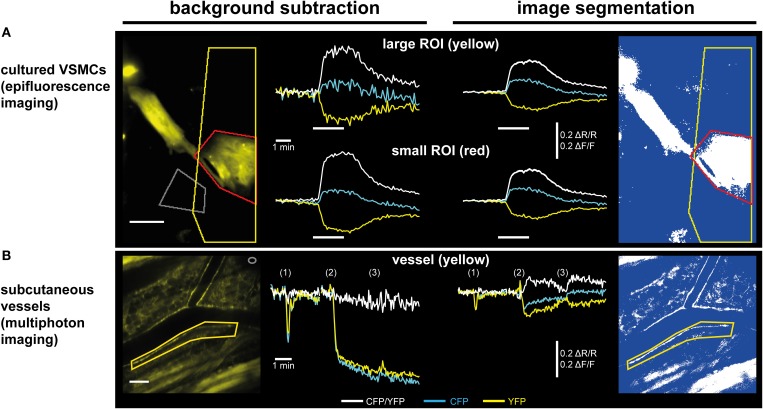
Figure 5.
Subtraction of a background region vs. image segmentation for evaluation of ratiometric FRET/cGMP imaging data. Traces show baseline-normalized CFP/YFP ratio changes (ΔR/R; white) or baseline-normalized CFP and YFP intensity changes (ΔF/F; cyan and yellow, respectively). (A) Evaluation of epifluorescence recordings of cGi500-expressing cultured vascular smooth muscle cells (VSMCs) isolated from R26-CAG-cGi500(L1) mice. White bars indicate superfusion with 100 nM DEA/NO. Upon subtraction of a background region (left, gray ROI), selection of a large ROI (yellow) containing a high proportion of dim/non-fluorescent background increases noise (upper left) as compared to a small ROI (red) containing mainly the fluorescent cell (lower left). Applying image segmentation (right, see Figure 4 for further details) with the same ROIs results in lower ΔF/F and ΔR/R changes. The noise levels are not affected by the proportion of dim/non-fluorescent background within a ROI and thus, results are the same for small and large ROI. Scale bar, 50 μm. (B) Evaluation of in vivo FRET/cGMP recordings obtained from subcutaneous vessels via MP microscopy through a DSC; numbers in brackets indicate bolus drug applications: (1): 100 μL 0.9% NaCl; (2), and (3): 100 μL 1 mM DEA/NO. The image was taken right before the first DEA/NO injection. Subtraction of a background region (left, gray ROI in top right corner) is not suitable for evaluation, because DEA/NO-induced vasodilation causes massive drops in fluorescence intensities due to an increased contribution of dim/non-fluorescent vessel lumen to the ROI defining the vessel wall (yellow). This large drop obscures comparably small alterations in CFP and YFP fluorescence caused by cGMP-induced changes in FRET efficiency. When image segmentation is used (right), dim/non-fluorescent structures do not contribute to mean ROI intensities, leading to much smaller drops in CFP and YFP fluorescence, and cGMP-induced ΔR/R changes are revealed. Scale bar: 100 μm. (B) is modified from Thunemann et al. (2013b).

