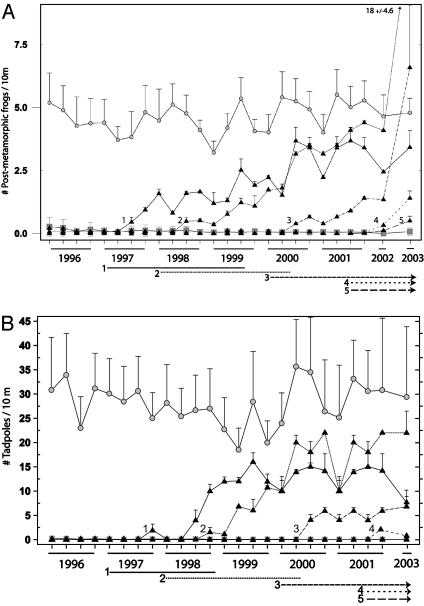
Fig. 3.
Density (mean ± SE) of postmetamorphic R. muscosa (A) and larval R. muscosa (B) in 21 lakes from 1996 to 2003. Filled triangles designate fish removal lakes (n = 5); numbers correspond to lake numbers in Fig. 1. Shaded circles are fishless control lakes (n = 8), and shaded squares are fish control lakes (n = 8). Horizontal lines at the bottom of each figure indicate the trout removal period for each of the removal lakes, and numbers correspond to individual lake numbers. No tadpole counts were conducted in 2002.

