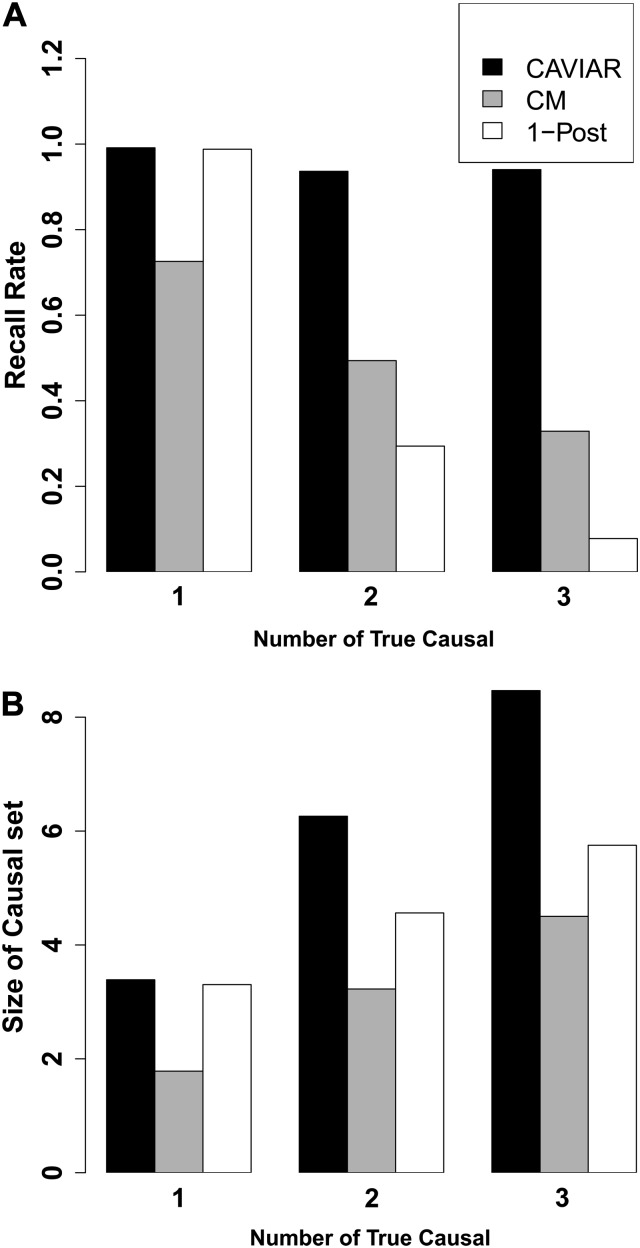
Figure 3.
Comparison of each method’s performance on the simulated GWAS data. (A) The recall rate for each method. (B) The number of causal SNPs selected by each method. CM is the conditional method and 1-Post is the method proposed by Maller et al. (2012). In both panels the x-axis is the true number of causal SNPs that we have implanted in each region. In the scenario of one causal SNP both our method and 1-Post have similar results as both methods use the 95% confidence interval to select a SNP as causal. However, for scenarios in which we have more than one causal SNP, our method outperforms 1-Post.

