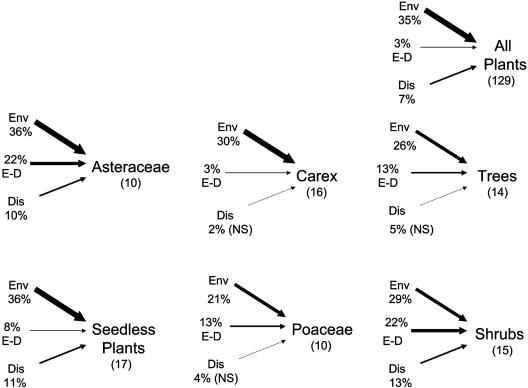
Fig. 3.
Partitioning the variation in plant distributions that can be accounted for by the environment (Env), dispersal (Dis), and environment correlated to dispersal (E-D). Note that dispersal effects here are referenced against a more complex spatial model than the simple distance decay models in neutral theory (see Methods). The thickness of arrows represents strength of relationship. Groups are the same as in Table 1, with numbers of species given in brackets.

