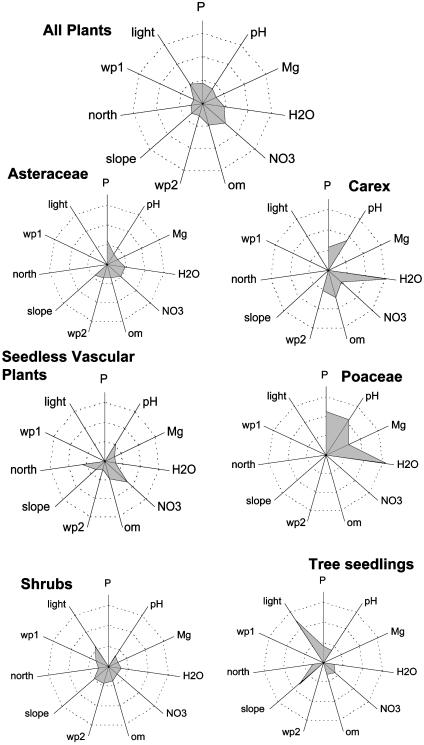
Fig. 4.
The partial contribution of environmental variables to the distribution of each species group. Groups are the same as in Table 1, with each group standardized to total explained variation. Differences in total variation shown are due to the elimination of the covariances among environmental variables. Environmental variables are represented by their chemical symbols and by the following: H2O, soil moisture; om, loss on ignition; wp1 and wp2, meso- and microslope positions; north, north to south aspect; light, available direct and indirect light. Rings around the origin represent percent variation, with rings increasing in 10% increments to a maximum of 30% at the outer ring.

