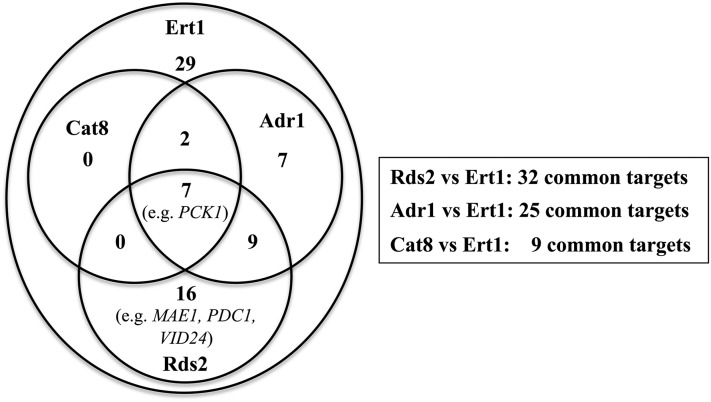
Figure 10.
Overlap between Ert1 targets and those of Cat8, Rds2, and Adr1. Values in the Venn diagram (left panel) refer to the number of genes that are common targets for specified regulators. The number of overlapping genes with Ert1 and a specific regulator is also indicated in the right panel. Forty-one percent (29/70) of the Ert1 target genes did not overlap with the Cat8, Rds2, and Adr1 targets. ChIP-chip data for Adr1 and Cat8 were taken from Tachibana et al. (2005), while data for Rds2 were from Soontorngun et al. (2007). ChIP-chip data for Cat8 and Adr1 were obtained with cells grown under low glucose conditions, while the assay for Rds2 was performed with ethanol as a carbon source.

