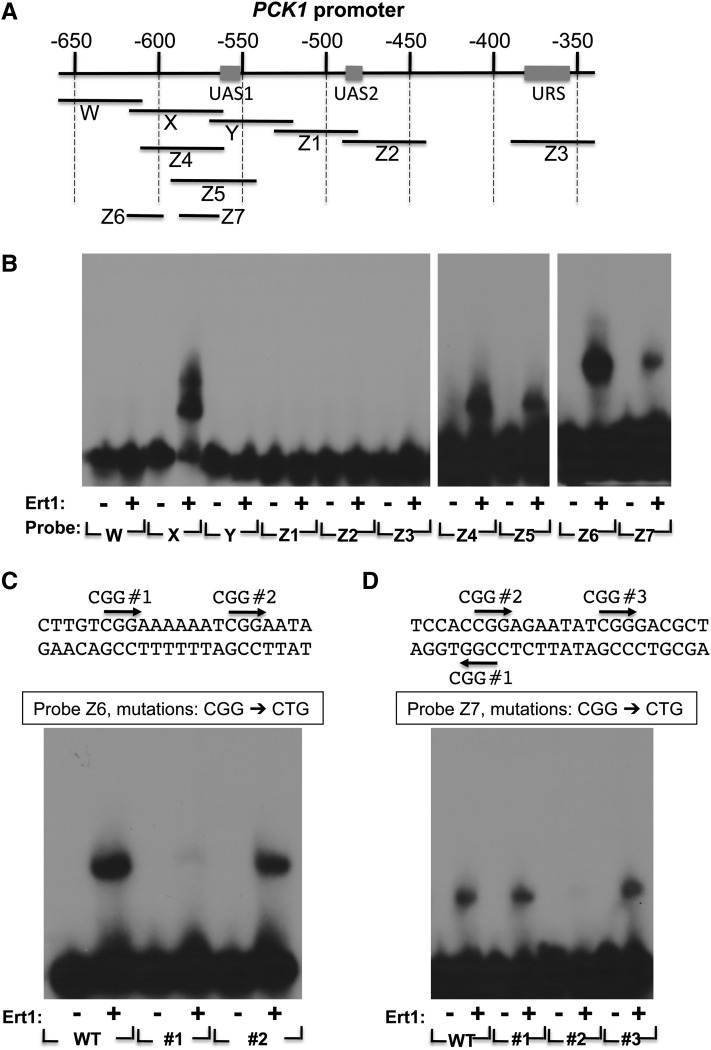
Figure 5.
Ert1 binds to the PCK1 promoter. (A) Schematic view of the PCK1 promoter. Coordinates (in base pairs) are given relative to the ATG (+1 bp). Upstream activating sequences (UAS1 and UAS2) and an upstream repressing sequence (URS) (Proft et al. 1995) are shown as rectangles. Probes used for EMSA are shown as black lines. (B) Ert1 (aa 1–152) binds to two sites in the PCK1 promoter. Various probes were incubated (+) or not (−) with the purified DNA binding domain of Ert1 for EMSA analysis. (C) Mutational analysis of the binding site Z6 of Ert1. DNA sequence of probe Z6 (see A) is shown at the top as well as the two CGG triplets (CGG no. 1 and no. 2). The effect of mutating either CGG triplets to CTG on Ert1 binding was tested by EMSA. WT, wild\x{2010}type. (D) Mutational analysis of the binding site Z7 of Ert1. DNA sequence of probe Z7 (see A) is shown at the top as well as the three CGG triplets (labeled CGG nos. 1, 2, and 3). The effect of mutating either CGG triplets to CTG on Ert1 binding was tested by EMSA.

