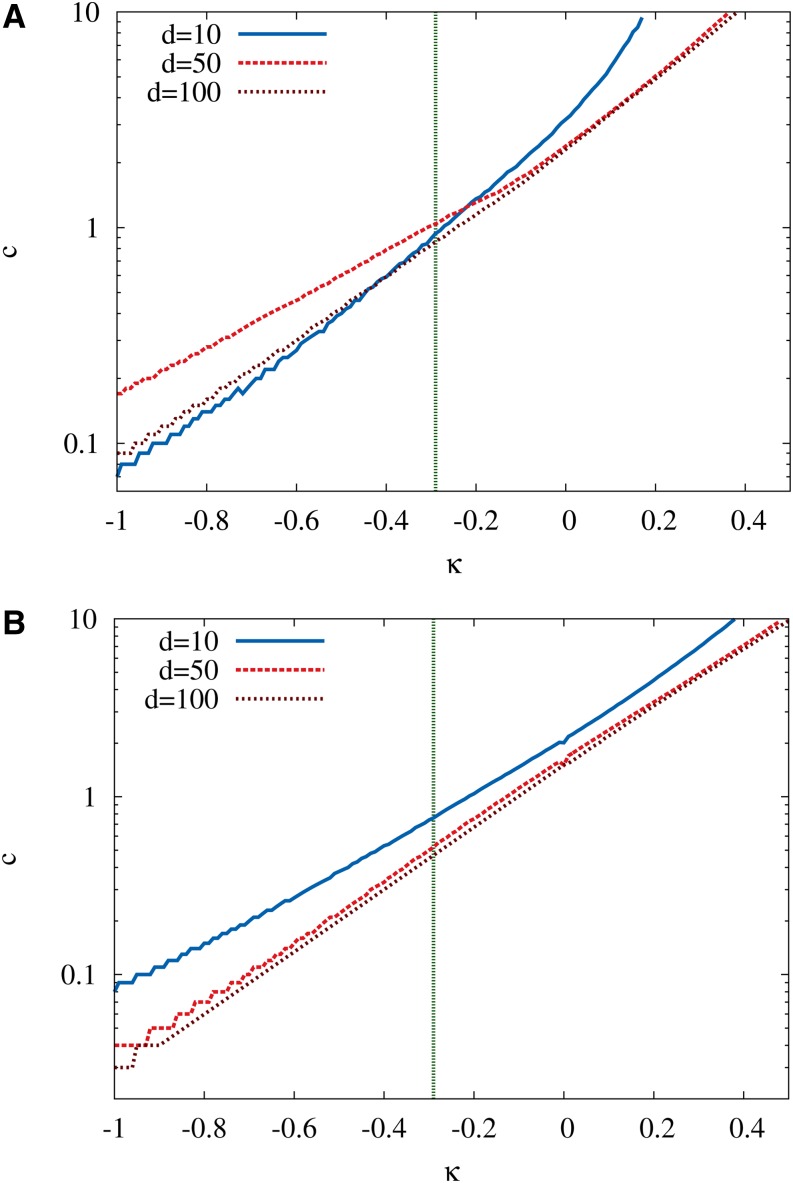
Figure 10.
The minimal value of the RMF parameter c required to generate on average nine exceedances after an adaptive step. (A and B) Results for initial rank 1 (A) and initial rank 3 (B). The random fitness component is assumed to be distributed according to the GPD with EVT index κ, and different curves correspond to different values of the initial distance d to the reference sequence. The experimental estimate κ ≈ −0.29 of the EVT index is indicated by a vertical line. The total number of loci is L = 1000. Figure C1 shows the same results in a plot where the additive selection coefficient has been scaled by the standard deviation of the distribution of the random component.

