FIGURE 3.
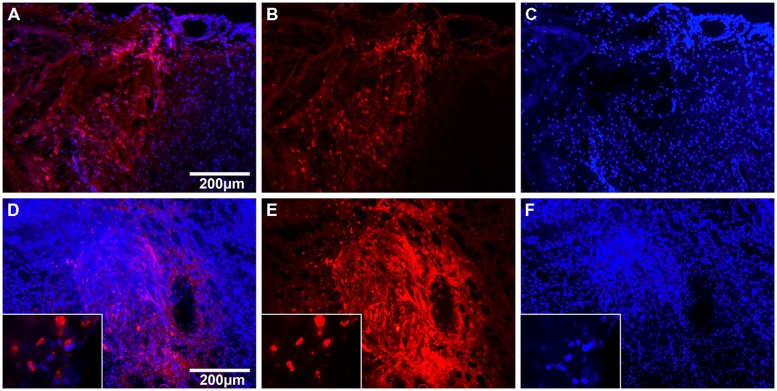
Cell tracking with TAMRA 24 h after hNPC transplantation. Fluorescent images of brain slices 24 h after systemic (A–C) and local (D–F) transplantation of TAMRA-stained human fetal neuronal progenitor cells. Cell nuclei are displayed in blue (DAPI) and TAMRA positive cells in red. (A–C): The left side of images shows the impact area with rarefied cell density. In the center one can identify the border zone with many infiltrated TAMRA-positive cells and on the right side the adjacent unharmed cortex. (D–F): The images display the injection canal with multiple surrounding TAMRA-positive cells. In higher magnification (x100) one can identify single cells and their nuclei.

