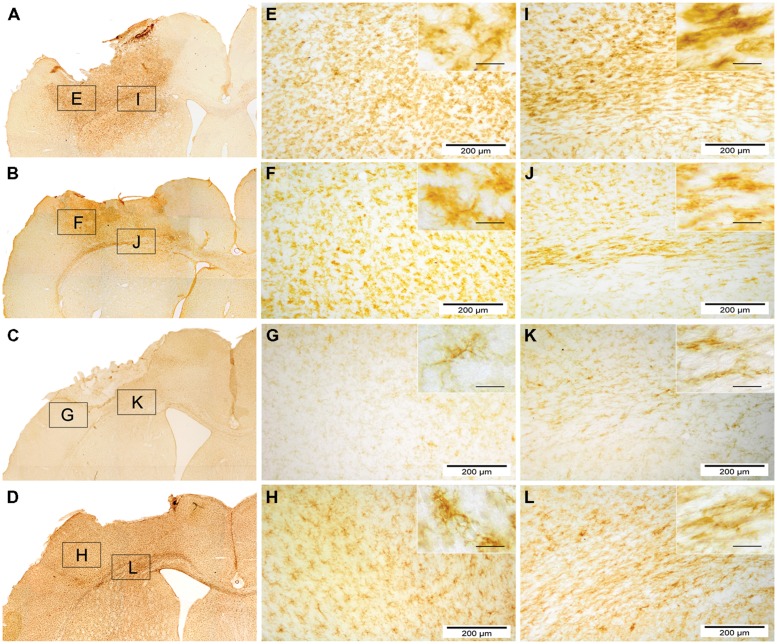
FIGURE 8.
Overview of microglial activity (CD11b) 7 and 84 days after local and systemic hNPC transplantation. CD11b stained photomicrographs of locally and systemically transplanted animals 7 days and 84 days after transplantation. (A–D) display an overview of a locally transplanted animal 7 days (A) and 84 days (C) as well as a systemically transplanted animal 7 days (B) and 84 days (D) after transplantation. (E–L) depict the border zone beneath the impact area (E–H) and the corpus callosum with the adjacent cortex and putamen (I–L). Insets show details of each subgroup at high power (scale bars = 40 μm).

