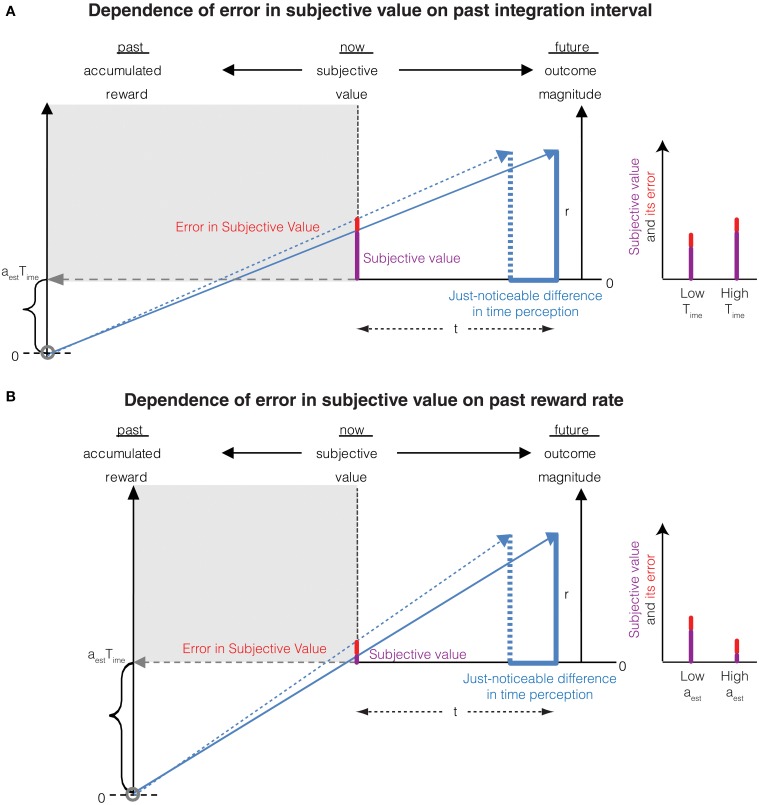
Figure 3.
(A) The Weber fraction of error in subjective value decreases with an increase in the past integration interval. This is mathematically represented in Equation (8). Compared to Figure 2 (represented as low Time in the graph on the right), the past integration interval is larger in this panel, thus reducing the error in subjective value while increasing the subjective value. The Weber fraction is thus smaller. (B) The Weber fraction of error in subjective value increases with an increase in the past reward rate. This is mathematically represented in Equation (8). Compared to Figure 2 (represented as low aest in the graph on the right), the past reward rate is larger in this panel, thus increasing the error in subjective value while decreasing the subjective value. The Weber fraction is thus larger.

