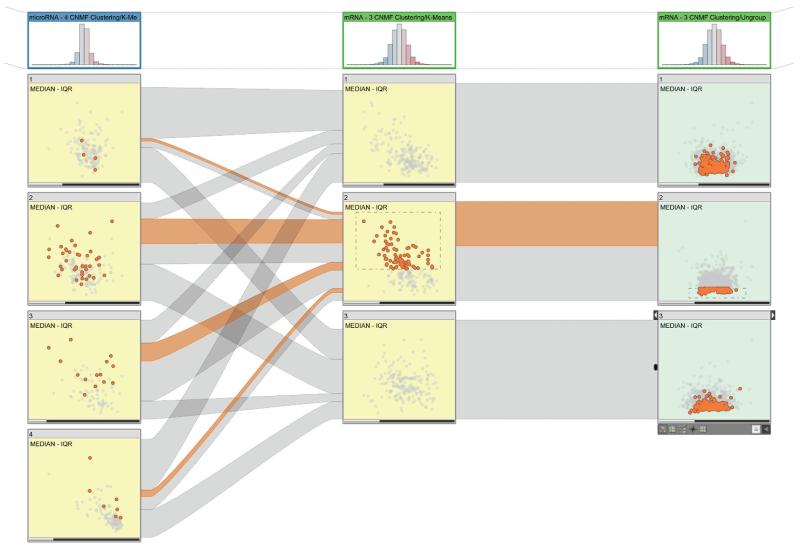
Figure 2. Dual-analysis views in StratomeX.
The first column shows a four-cluster stratification for a microRNA (miRNA) dataset. The scatterplots show the median versus the interquartile range (IQR) for the cluster samples. The second column shows a three-cluster stratification for a messenger RNA (mRNA) dataset, again showing samples. The third column uses the same three-cluster stratification for the same dataset but shows genes instead of samples. The sample scatterplots (yellow) depict the statistical characteristics of each cluster’s members; the gene scatterplots (green) depict statistics computed for the genes using only the samples from the cluster represented by the block. The selection of samples is highlighted in the first two columns and in the ribbons. The selection of the genes enables investigation of the distribution of expression values for the genes for different clusters in a stratification.

