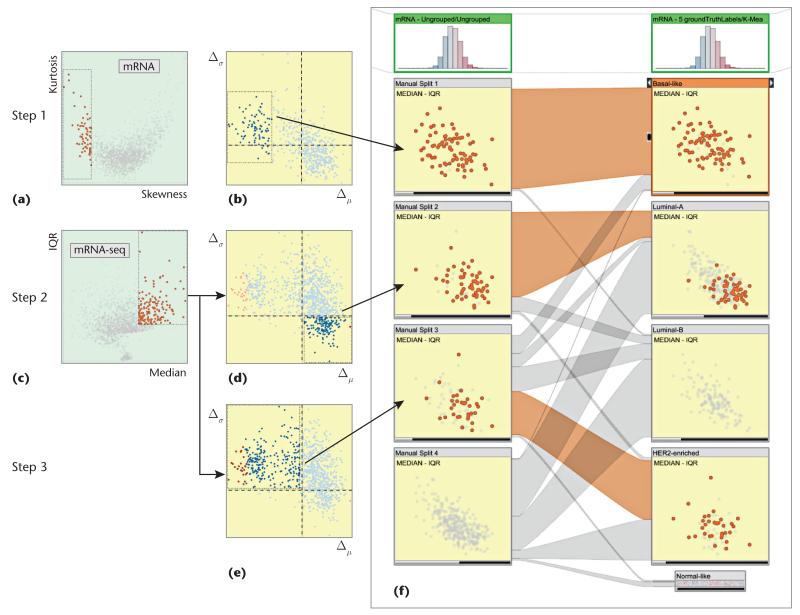
Figure 6. Manual clustering of an unstratified mRNA dataset using dual-analysis views.
(a) We selected negatively skewed genes through a skewness-versus-kurtosis visualization. (b) The difference plot for the samples updated automatically; we observed a group of samples with lower values and marked them as our first cluster. (c) We then switched to the mRNA-seq dataset and selected genes that were more highly expressed with a large variety in the values. We identified two groups and marked them as (d) cluster 2 and (e) cluster 3. (f) For validation, we compared our stratification with the subtypes from the reference study and observed a significant overlap of the subtypes.

