
Fig. 1.
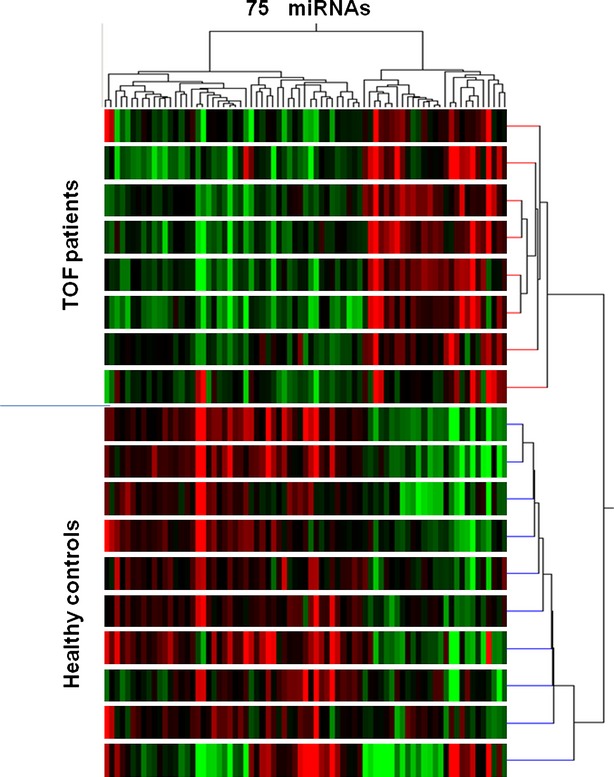
Heat map of the unsupervised hierarchical clustering of the 75 differentially expressed miRNAs. The expression profile of the 75 differentially expressed miRNAs distinguished two groups of samples examined, which correspond to 10 TOF patients and 8 health controls, respectively.