Fig. 1.

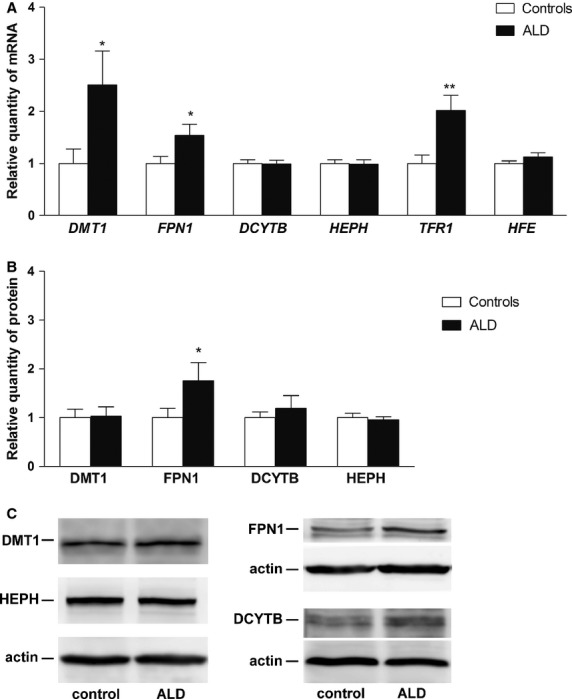
Gene expression of the analysed molecules in controls and patients with alcoholic liver disease (ALD). (A) mRNA expression of DMT1, FPN1, DCYTB, HEPH, TFR1 and HFE. (B) Protein expression of DMT1, FPN1, DCYTB and HEPH. (C) Western blot analysis of DMT1, FPN1, DCYTB, HEPH and actin (loading control). Results are depicted as means ± SEM. Statistically significant differences as compared with the control group are indicated by * P < 0.05, ** P < 0.01 and *** P < 0.001.
