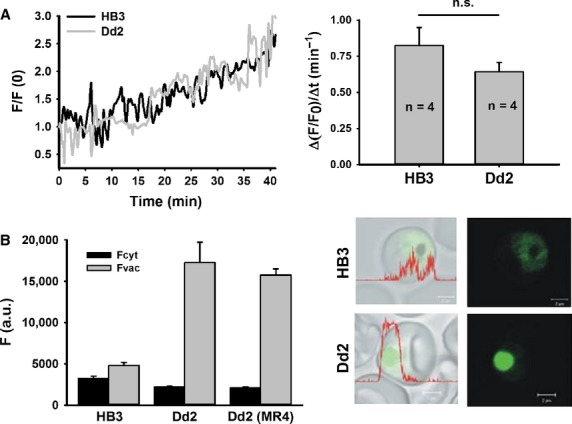
Fig. 2.

Global Fluo-4 uptake and fluorescence in HB3 and Dd2 Plasmodium falciparum-infected erythrocytes. (A) A time-lapse series measured the increase in fluorescence intensity within the complete host–parasite system circumference during incubation with 5 μM Fluo-4 AM in the external bulk solution. During this time frame (40 min), HB3 and Dd2 parasites showed a linear global Fluo-4 fluorescence increase and revealed similar uptake rates when all compartments were merged (left panel). The calculated increase rate of global fluorescence was not significantly different between HB3 and Dd2 parasites (n = 4 per strain, P = 0.24; right panel). (B) Mean Fluo-4 fluorescence quantified from the digestive vacuolar and cytoplasmic regions of several P. falciparum parasites. Dd2 parasites from our laboratory and Dd2 parasites from MR4 showed no significant difference in fluorescence. The mean ± SEM of at least 17 independent determinations collected over several days is shown (left). The right panel shows single images of P. falciparum-infected erythrocytes stained with Fluo-4 AM (green); scale bar, 2 μm.
