Fig. 2.

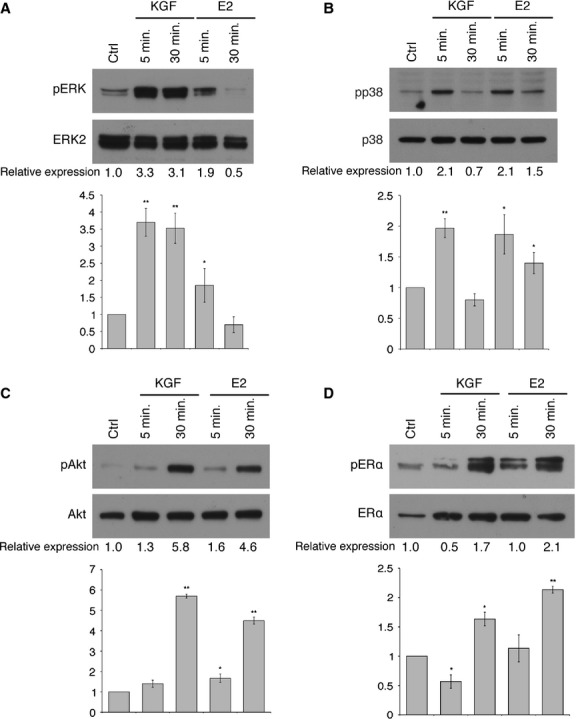
Effect of KGF and E2 on the activation of ERα non-genomic pathways. MCF-7 cells were treated with KGF (20 ng/ml) (1.1 × 10⁻⁹ M) and E2 (20 ng/ml) (7.3 × 10⁻⁸ M), for 5 or 30 min. (A) Western blot analysis with a phospho-specific ERK monoclonal antibody (pERK; Thr202/Tyr204). Levels of total ERK were assessed by blotting with an ERK2-specific antibody. (B) Western blot analysis with a phospho-specific p38 monoclonal antibody (pp38; Thr180/Tyr182). Levels of total p38 were assessed by blotting with a p38-specific antibody. (C) Western blot analysis with a phospho-specific Akt monoclonal antibody (pAkt; Ser473). Levels of total Akt were assessed by blotting with an Akt-specific antibody. (D) Western blot analysis with a phospho-specific ERα monoclonal antibody (pERα; Ser118). Levels of total ERα were assessed by blotting with an ERα-specific antibody. The images are representative of at least three independent experiments. The intensity of the bands was evaluated by densitometric analysis, normalized and reported in graphs as relative expression with respect to untreated cells (Ctrl). Error bars represent standard deviations. *P < 0.05, **P < 0.01.
