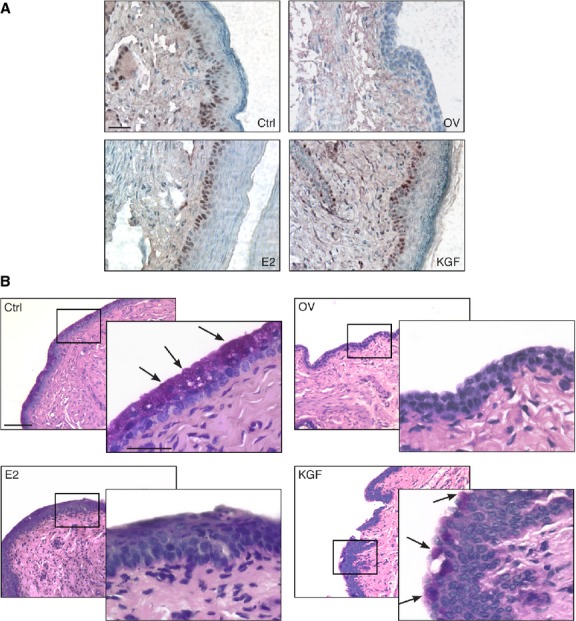
Fig. 7.

Characterization of the vaginal epithelium after treatment with KGF and E2. (A) Tissue sections were subjected to immunohistochemistry with an anti-PCNA antibody to assess basal cells proliferation. Sections were counterstained with haematoxylin. Representative tissue sections for each treatment group are shown (scale bar 50 μm). (B) Tissue sections were subjected to periodic acid-Schiff (PAS) staining procedures. Representative tissue sections for each treatment group are shown (scale bar 100 μm). A significant area in each panel is indicated by a square and an enlargement of this area is shown in the overlying panel (scale bar 50 μm). Arrows indicate PAS-positive cells.
